The Sales Dashboard Project Using Excel
Project information
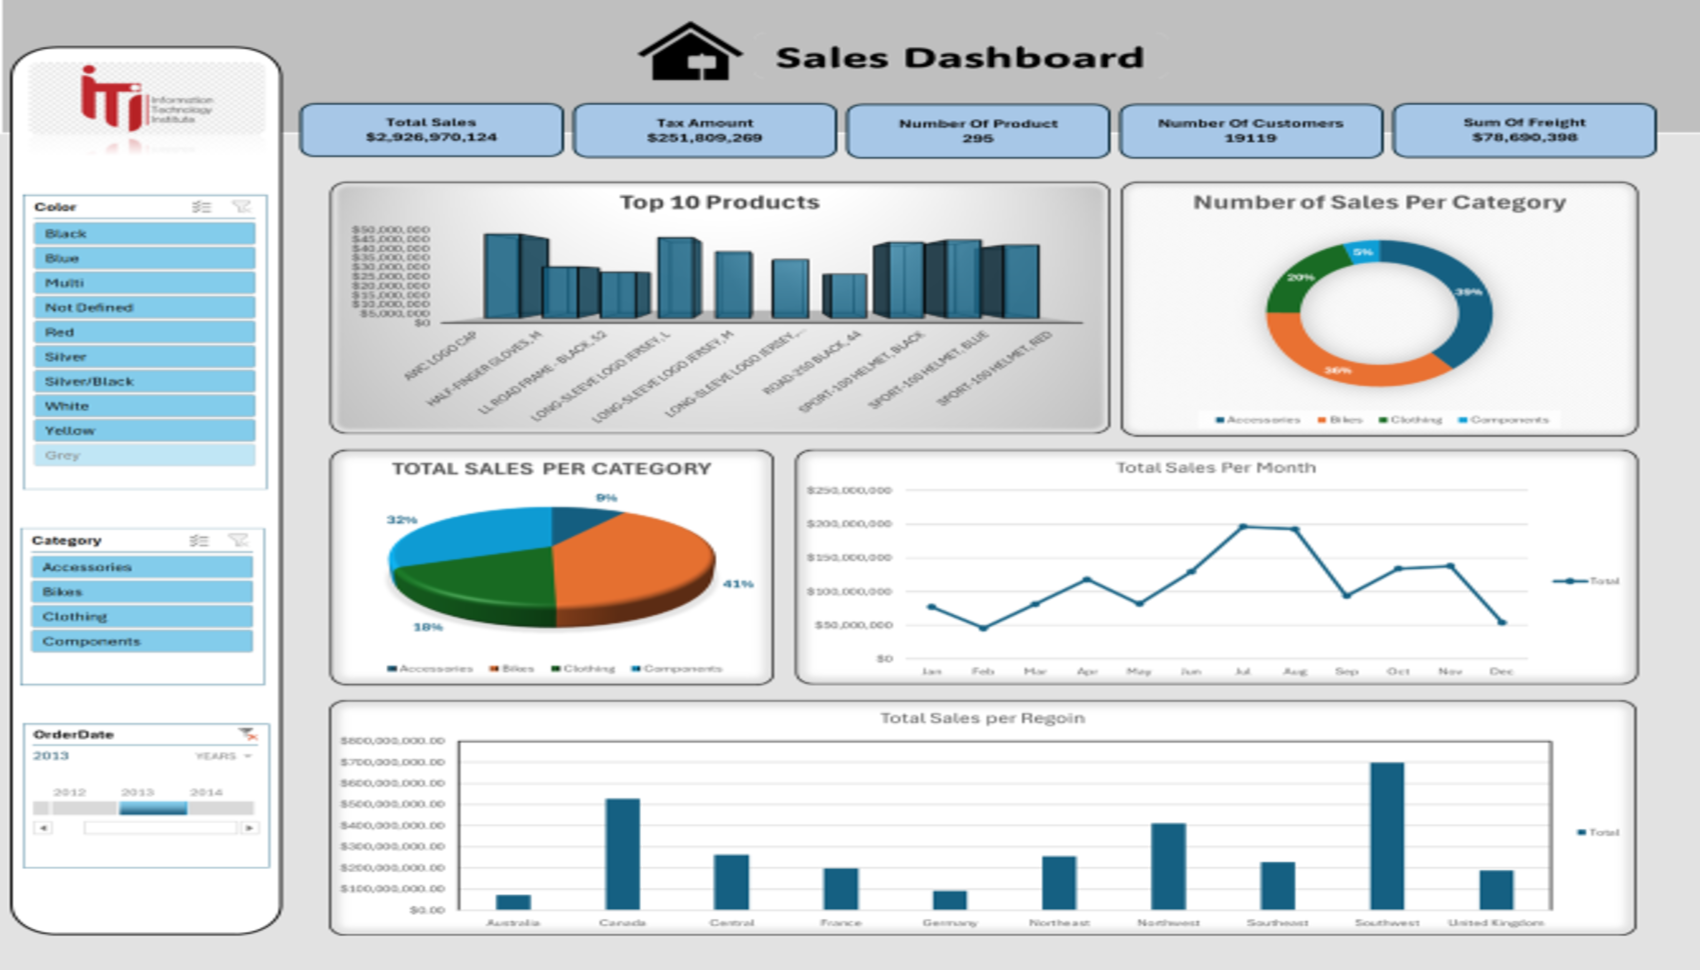
The Sales Dashboard is an interactive analytics solution built using Power BI, designed to provide clear insights into sales performance, product trends, customer behavior, and regional distribution.
- It highlights key metrics such as total sales, tax amounts, number of products sold, customer count, monthly sales, category performance, top-selling products, and sales by region.
- The dashboard enables stakeholders to monitor sales trends, evaluate product performance, track category contribution, and make data-driven decisions that improve sales strategy and operational efficiency.
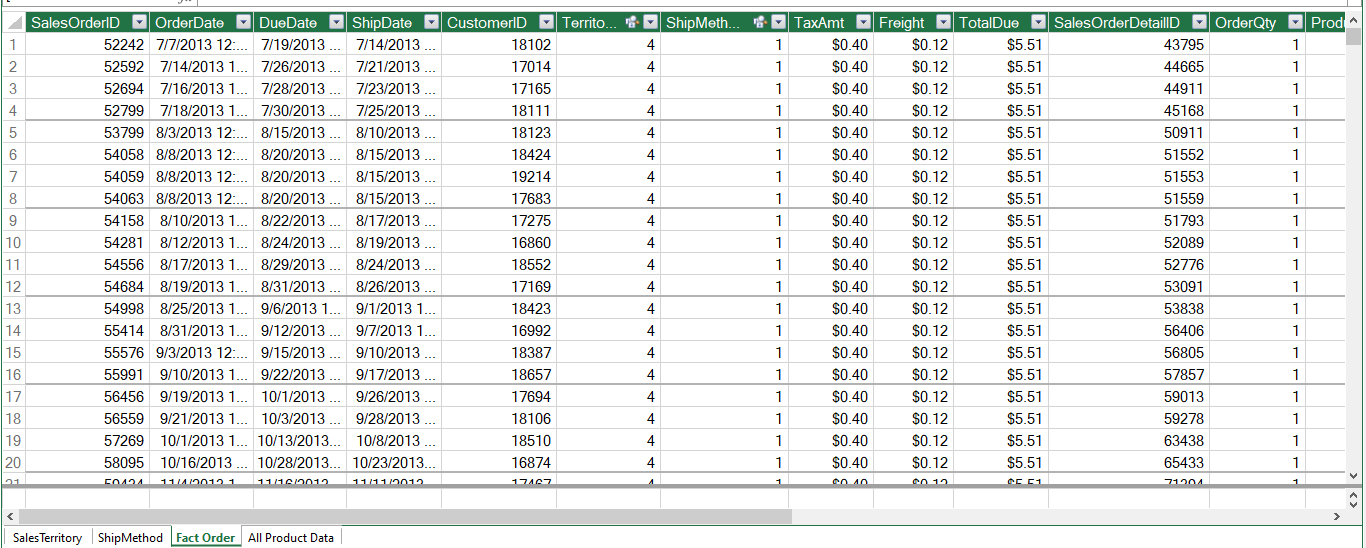
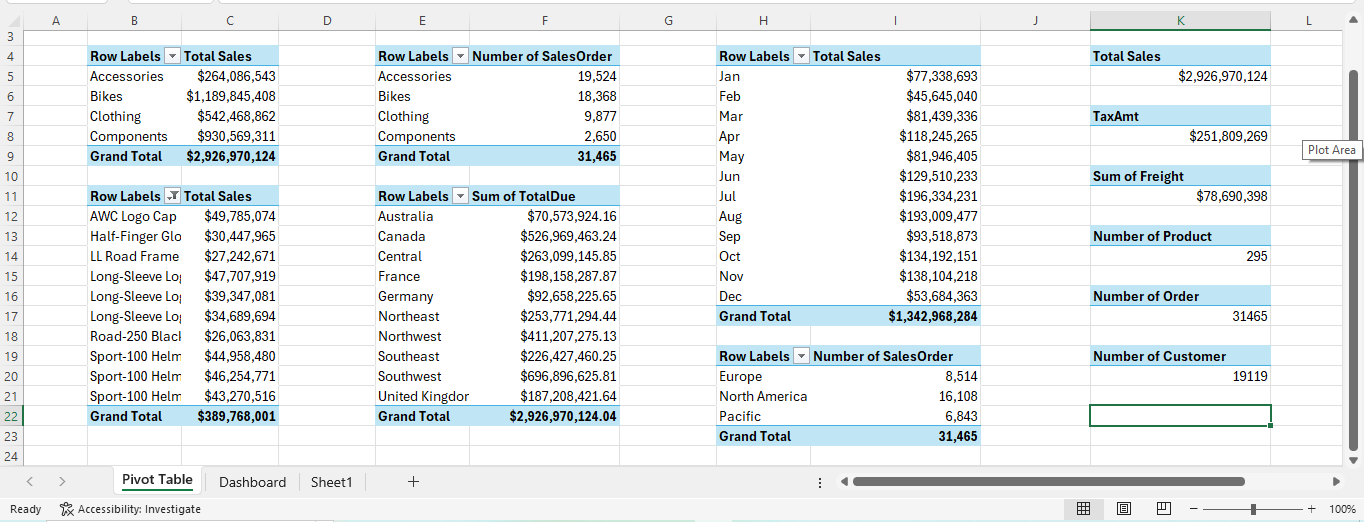
- This project demonstrates strong skills in data modeling, DAX calculations, ETL preparation, and designing user-friendly dashboards that transform raw sales data into actionable insights.